Past a certain number of moving parts, the question changes. It stops being “can I run this service?” and becomes “what is actually happening across all of this, right now?” Mission Control is my attempt to answer the second question for my own lab. It is small on purpose, and it only knows about things I actually run.
Too many small sources of truth
The lab has containers, host metrics, monitored endpoints, MQTT devices and model runtimes. Each can be inspected separately; the infrastructure map in My homelab doesn’t need Kubernetes shows where they live. Here, the problem is what each source can tell me—and what remains unclear until I compare them.
Side by side, each source answers its own question well and leaves the next one open:
| Source | What it knows | What it can’t tell me on its own |
|---|---|---|
| Portainer | Which containers exist and whether they run | Whether the service inside is actually answering |
| Uptime Kuma | Whether a monitored endpoint responds | What else is under strain on the same host |
| The host | CPU, RAM, disk and temperature | Which service is responsible for the load |
| MQTT | Which devices have spoken recently | Whether silence means broken, unplugged or asleep |
Each of those is easy to check, and that is the trap. Checking all of them is a small tax, and I pay it in context switches: open a tab, remember what that tool calls things, translate its answer back into the question in my head, open the next tab. By the fourth interface I have mostly forgotten what I came to find out.
Opening five dashboards isn’t intelligence. It’s me acting as the integration layer.
I didn’t want another monitoring dashboard
Monitoring tools are good at signals: this number, this check, this threshold. I already had plenty of those. What I was missing is closer to something I would ask a colleague: is the environment healthy enough for what I’m about to do?
That is a different question from “CPU: 23%”. Whether it’s a good moment to load a model, flash a device or restart a service depends on several signals at once, and on which of them matter for that particular job. A generic dashboard can’t know that. Mine can, because it only has to know about one lab.
So I stopped thinking of it as observability and started thinking of it as an operational surface: one place that carries enough of the shape of the lab to answer questions about it. I also didn’t want to adopt a platform designed for fleets and teams just to look at one mini PC and a handful of microcontrollers.
From status to context
Mission Control started as raw status and grew from there. It now exposes runtimes, telemetry, events, monitoring state, devices, project state and a history of recent activity. Host metrics such as CPU, RAM, disk and temperature are sampled every five minutes and kept for 90 days, which means a number can be compared with its own past instead of only being read as a live snapshot.
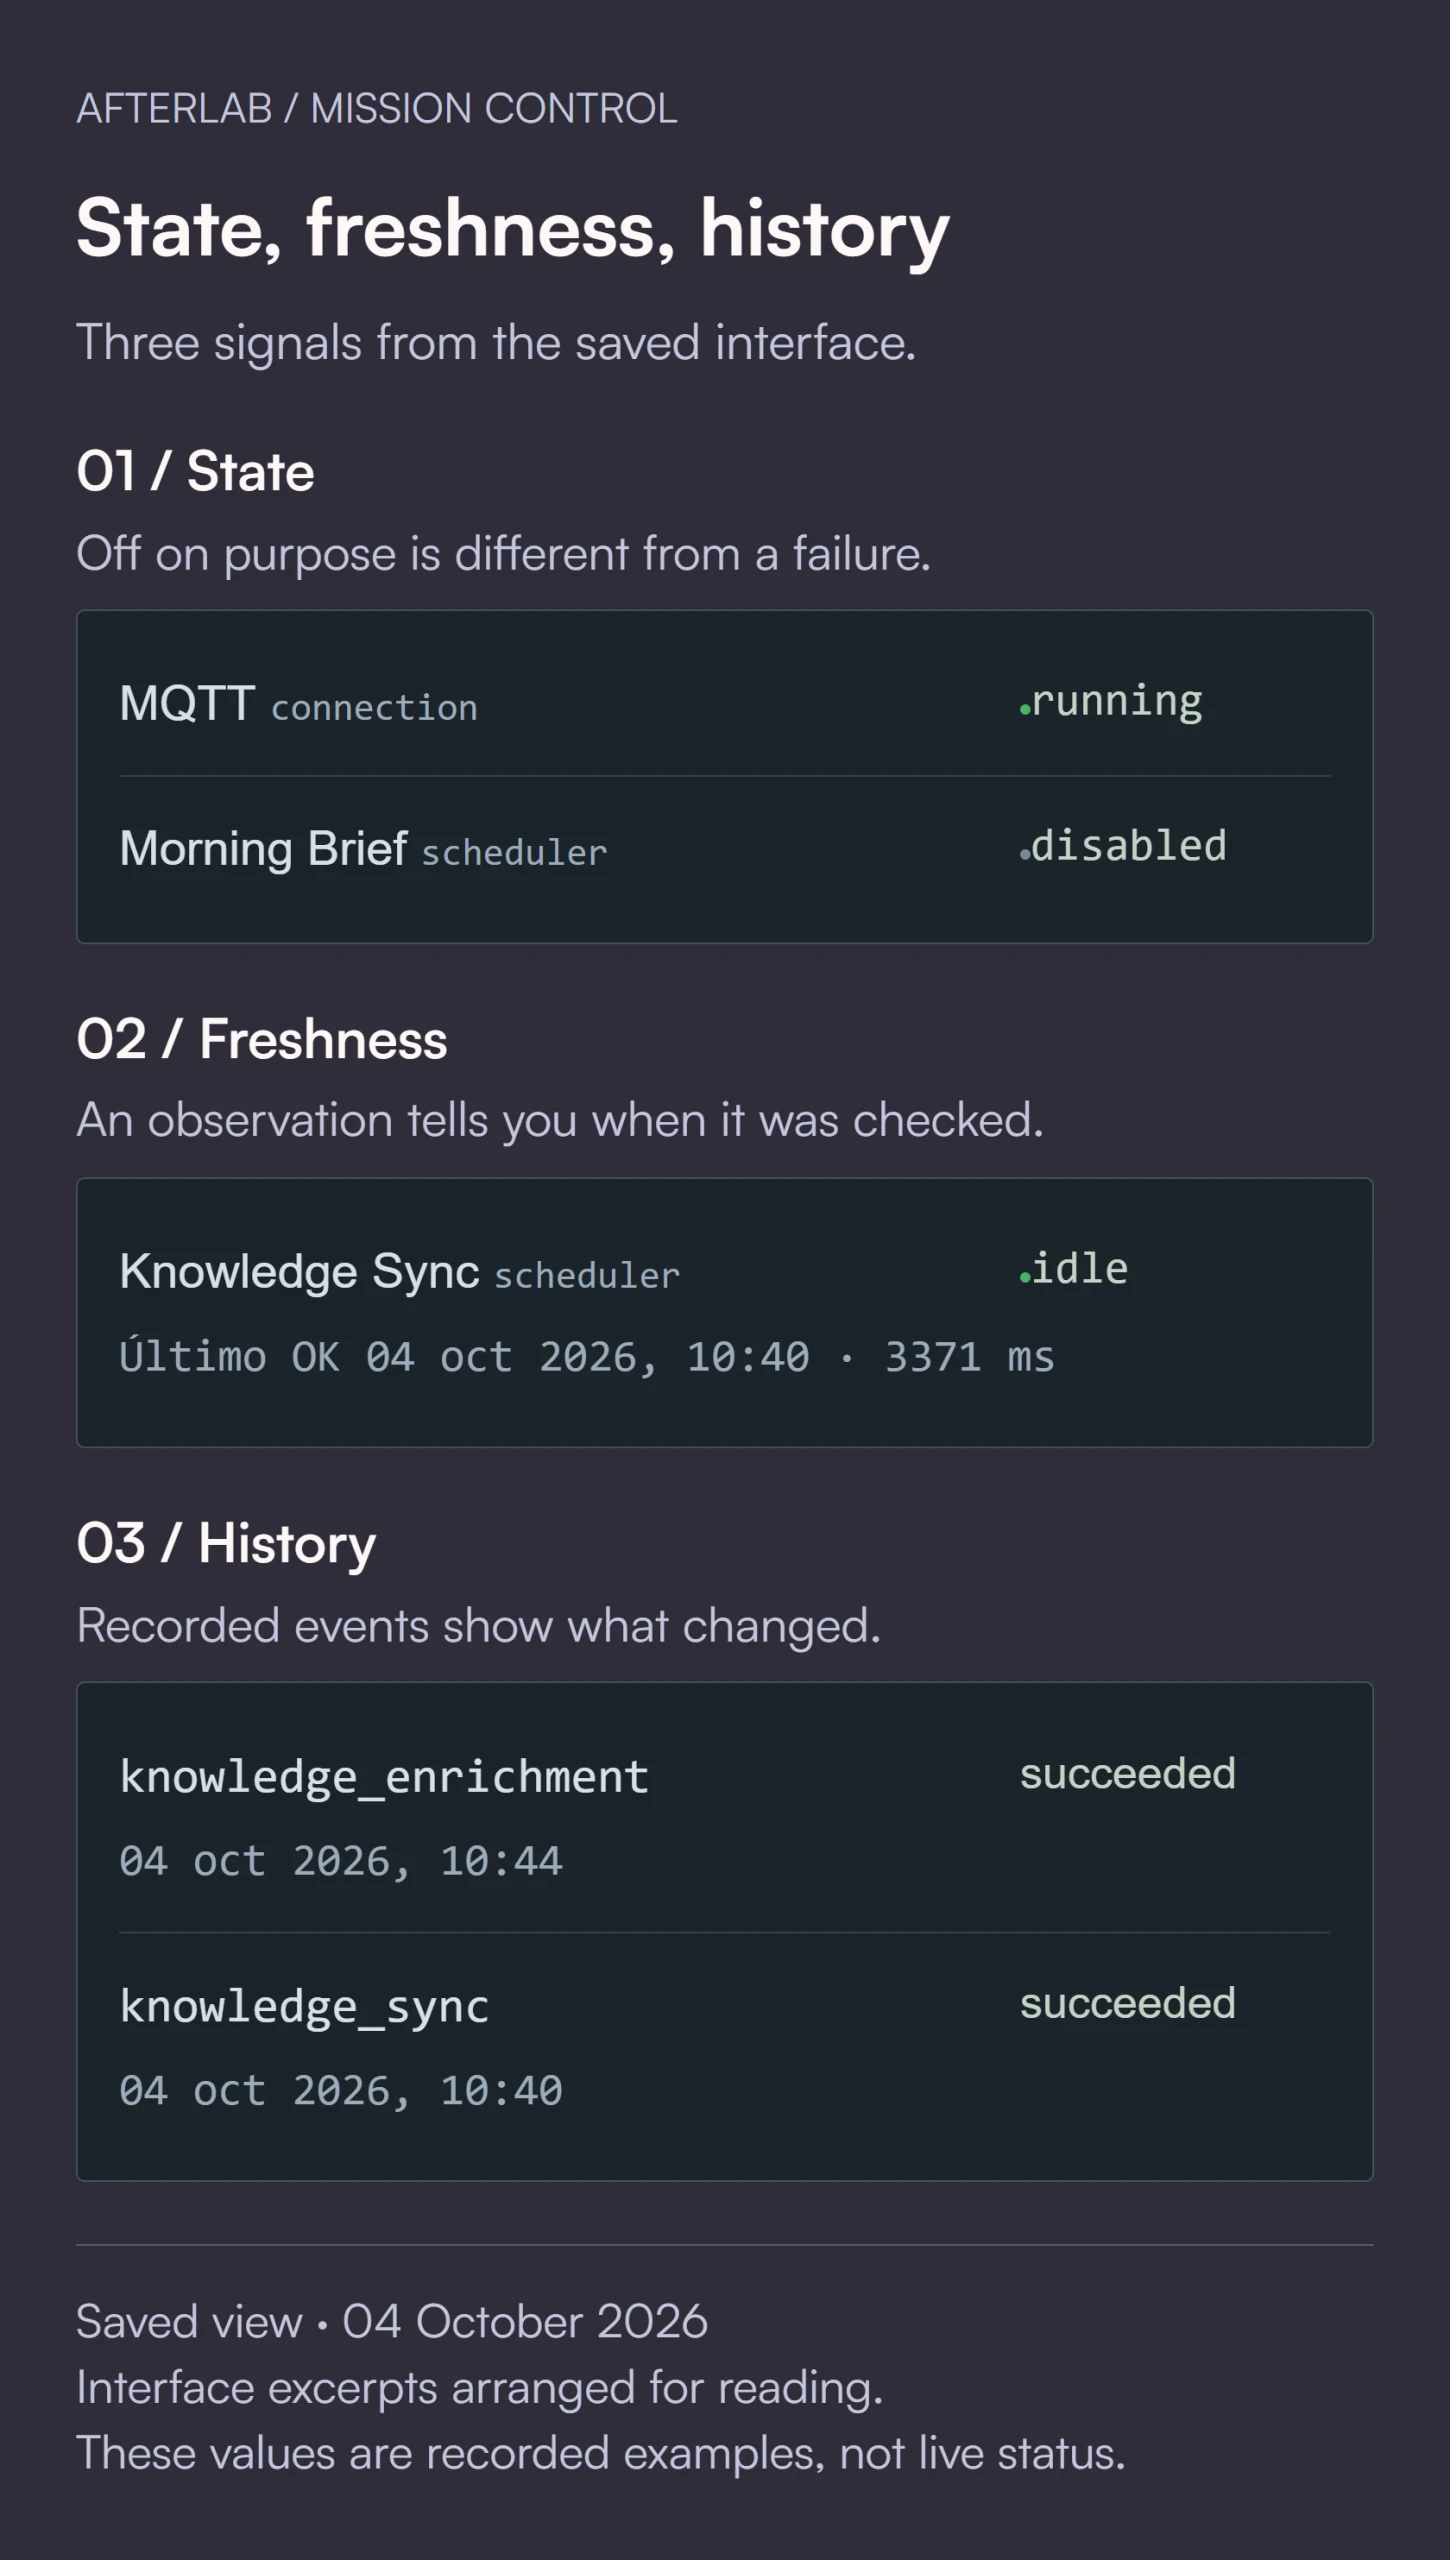
The change that mattered most was less visible than any chart: making states explicit. A component can be configured, enabled, unavailable or disabled, and those words mean different things.
In practice I read them like this:
| State | How I read it |
|---|---|
| Configured | The pieces exist and are wired up. It says nothing about whether it should be running. |
| Enabled | It is meant to be running. If it isn’t answering, that is worth my attention. |
| Unavailable | Enabled, but not reachable right now. This is the state that should get loud. |
| Disabled | Off on purpose. Quiet, and not a failure. |
“Offline” is the clearest example. A device that is offline because I unplugged it is not the same as a device that should be up and isn’t. A service that is disabled on purpose is not unavailable. A runtime that was never configured isn’t failing; it just doesn’t exist yet. If all of those collapse into one red dot, the dashboard slowly teaches me to ignore red dots. Separating them took more work than drawing the dots, and it’s the part I would defend hardest.
A device goes quiet: what would I check?
Take a worked example, rather than a report of a particular incident: a door node has stopped publishing. I would first check whether it is enabled and how old its last observation is. If it is disabled on purpose, silence is expected. If it should be reporting, I would then compare its last message with the broker runtime and recent events. A healthy broker narrows the investigation; it does not prove that the device itself is broken.
The useful conclusion is “this enabled node has not reported since the last recorded observation.” “The device is broken” would go beyond the evidence. The panel should make the missing signal and its age visible so I can decide what to inspect next.
A smaller version of the same idea sits on my desk, on the Pixel CrowPanel. It shows host CPU, RAM and disk, monitor status and container status. At one point it was reading 4/4 monitors and around 21 containers. I mention the numbers only as a snapshot of that moment; they aren’t a claim about what the lab looks like today.
Why Pixel needs this too
Mission Control isn’t only for me, and this is the part I would have underrated at the start.
Pixel is the assistant layer on top of the lab. If it reasons about the lab without a shared picture of it, it is reasoning in a vacuum. It can produce fluent sentences about containers and still be wrong about which ones exist. The questions I want to ask it are the same ones I ask the panel: what is running, what failed, what changed, is this service off on purpose, is that device merely unavailable, what happened recently.
Those answers should come from the same model of the environment that I look at. That is the direction I’m building towards: Mission Control and Pixel as two views of one operational model, one for eyes and one for questions. The details of evidence, age and the limits of remembered state are in What does “memory” actually mean for a personal AI agent?
I try to be careful about how much that claims. Pixel doesn’t “understand” the lab in any rich sense. It can read particular sources and, in some cases, combine a few of them. Most of the time I am still the one looking at the panel. If you are curious about how I tested one narrow slice of this, how well a model picks which sources to read, the source-selection benchmark in AI.003 reports the results.
The interesting part isn’t the dashboard
The UI is almost incidental. I could redraw it and nothing important would change, because nothing important lives there. What lives underneath is a model: which things exist, what state each one is in, how fresh that state is, and what has changed since I last looked. If that model is wrong, a nicer panel only makes it wrong more convincingly.
That’s also why it stays tiny. I don’t need pluggable data sources or a query language. I need the handful of questions I actually ask, answered the same way every time, by something that tells me when it can’t answer.
Small systems deserve good tools too
Observability is usually described as something you earn at scale. I think the need shows up earlier, and it follows the number of independent pieces rather than the number of users. A one-person lab can have plenty of pieces.
What changes is the shape of the right solution. At home it can be tiny, opinionated and built around one person’s real questions, and it can be thrown away and rebuilt when those questions change. I still don’t know how well the model underneath will hold up as the lab grows. For now it answers the question I started with: what is going on, and is it okay to carry on?
The full system around this lives on the Afterlab project page. The other half of the problem, how Pixel should remember what it has seen, is in What does “memory” actually mean for a personal AI agent?